ChartPixel.com
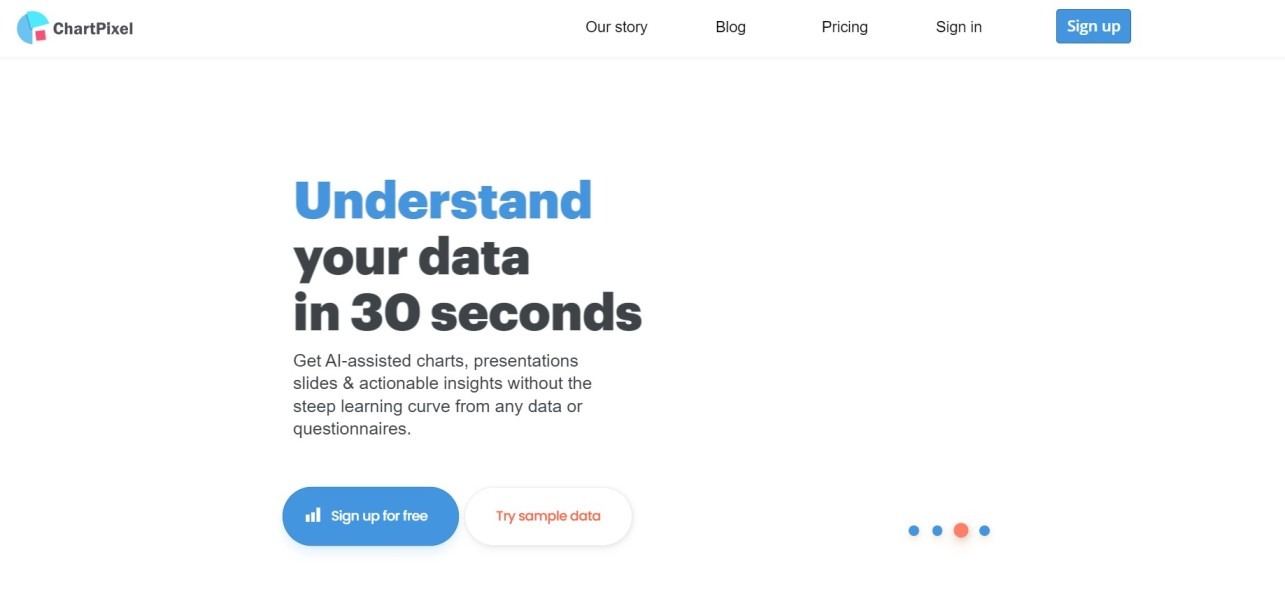
Explore, Understand, Visualize your data in 30 second.
Highlights
- Free plan available
- Automated data cleaning
- AI-assisted data analysis
App Specs
-
Free Trial
Yes
-
Pricing
Freemium
-
Language
English
-
Platform
Web
What Is ChartPixel?
ChartPixel is like a magic wand for your data. It’s a clever tool that uses AI, or artificial intelligence, to help you make sense of all those numbers and words. Imagine you have a bunch of data, maybe from an Excel file or a survey you did. Instead of staring at it for hours, feeling overwhelmed, you can just upload it to ChartPixel.
Once your data is in ChartPixel, it works its magic. It quickly creates colorful charts and graphs to show you what’s going on. These charts aren’t just pretty pictures—they help you understand your data better. ChartPixel can spot trends and patterns that might not be obvious at first glance.
One really cool thing about ChartPixel is that it’s super easy to use. You don’t need to be a computer whiz or a math genius to figure it out. Whether you’re a student learning about data analysis, a business analyst crunching numbers, or a journalist digging for stories, ChartPixel makes it easy to explore your data.
And if you’re worried about messing up or not knowing where to start, don’t be. ChartPixel guides you through the whole process. It picks out the most important parts of your data and suggests the best ways to visualize it.
Plus, ChartPixel can even search the internet for keywords related to your data. This can be really handy for things like improving your website’s search engine ranking or finding interesting facts for a report.
There are different plans you can choose from depending on your needs. There’s a free option if you just want to try it out, or you can pay for more features. There are plans for individuals, like students or researchers, and plans for businesses too.
So, whether you’re trying to understand survey results, track business trends, or just explore data for fun, ChartPixel is like having your own personal data assistant. It’s like having a friend who’s really good at math and always knows the answers!
Key Features
- AI-Assisted Chart Creation: Automatically selects relevant data and chart types for easy visualizations.
- User-Friendly Interface: Intuitive design caters to users of all skill levels.
- Smart Data Cleaning: Handles messy data and creates new features for thorough analysis.
- Insightful Annotations: Provides AI-driven explanations of data patterns and trends.
- Versatile Data Input: Upload data from Excel, CSV files, webpages, and more.
- Interactive Charts and Insights: Turns raw data into interactive visuals and written insights.
- Data Understanding Made Easy: AI-assisted written insights and statistics help users grasp the big picture effortlessly
Use Cases
- Students and Educators
- Business Analysts
- Researchers
- Hournalists and Editors
Pricing
Individual Plans
- Free – $0
- Credit Package – ₹499 for 5 credits
- Gold Subscription – ₹1349 per month
Business
- For Teams – $14.99 per month per member billed annually
- Premium – From $250 per month billed annually
Screenshots & Video
ChartPixel Alternatives
BotBunch
BotBunch is your go-to destination for AI tools, making the world ofartificial intelligence accessible to all. Our mission is simple: simplify AI discovery. Whether you’re looking for AI copywriters, image generators, transcription services, SEO automation, or more, our directory has you covered.


